Chapter 6: Creating a Visualization 135
iTool Developer’s Guide Creating a New Visualization Type
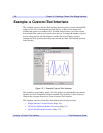
visualizations. The general idea is that when a data item is disassociated from a
visualization parameter, one or more properties of the visualization may need to be
reset to reasonable default values. For example, in the case of a plot visualization, if
the plotted data is disconnected, we want to reset the data ranges to their default
values and hide the plot visualization.
See “IDLitParameter::OnDataDisconnect” (IDL Reference Guide) for additional
details.
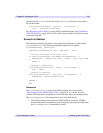
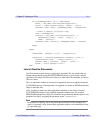
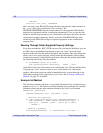
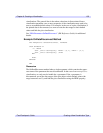
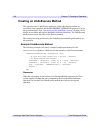
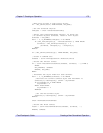
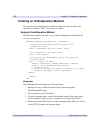
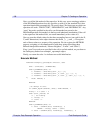
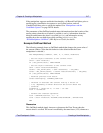
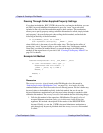
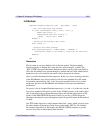
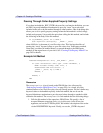
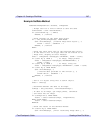
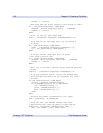
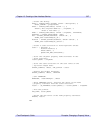
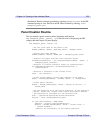
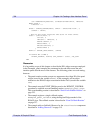
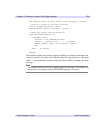
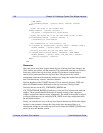
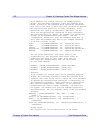
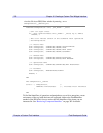
Example OnDataDisconnect Method
PRO ExampleVis::OnDataDisconnect, ParmName
CASE ParmName OF
'Y': BEGIN
self._oPlot->SetProperty, DATAX = [0,1], DATAY = [0,1]
self._oPlot->SetProperty, /HIDE
END
ELSE:
ENDCASE
END
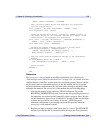
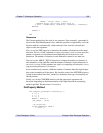
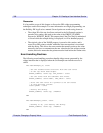
Discussion
The OnDataDisconnect method takes a single argument, which contains the upper-
case name of the parameter that was disconnected. In the case of our
ExampleVis
visualization, we only need to handle the
Y parameter. If the Y parameter is
disconnected, we set the data ranges of the plot object to their default values (the
range between 0 and 1), and hide the plot visualization using the HIDE property.