Chapter 6: Creating a Visualization 115
iTool Developer’s Guide Predefined iTool Visualization Classes
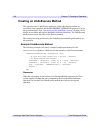
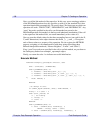
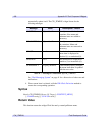
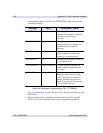
Predefined iTool Visualization Classes
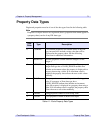
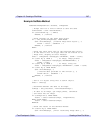
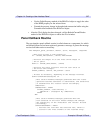
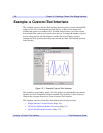
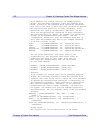
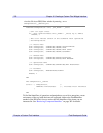
The iTool system distributed with IDL includes a number of predefined visualization
classes. The visualization type (the TYPE keyword value of the visualization with
which it is initialized) and the accepted data type(s) are shown for the predefined
visualization classes. You can include these visualization classes in an iTool directly
by registering the class with your iTool (as described in “Registering a Visualization
Type” on page 136). You can also create a new visualization class based on one of the
predefined classes. Visualization classes are located in the
lib/itools/components subdirectory of the IDL directory.
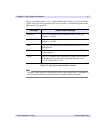
IDLitVisAxis
Displays a single axis object.
Visualization type: IDLAXIS
Data Types Accepted
•None
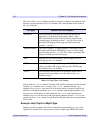
IDLitVisColorbar
Displays a color bar.
Visualization type: IDLCOLORBAR
Data Types Accepted
• Palette data: IDLPALETTE
IDLitVisContour
Displays a two-dimensional or three-dimensional contour plot.
Visualization type: IDLCONTOUR
Data Types Accepted
• Z data: IDLARRAY2D
• X and Y data: IDLVECTOR
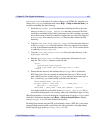
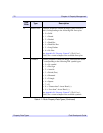
IDLitVisHistogram
Displays a histogram plot of the input data.
Visualization type: IDLPLOT