Click on the iStep logo at the top right corner of
the screen. A menu will appear in the upper left
corner. The menu choices will remain available
until used or canceled.
Menu
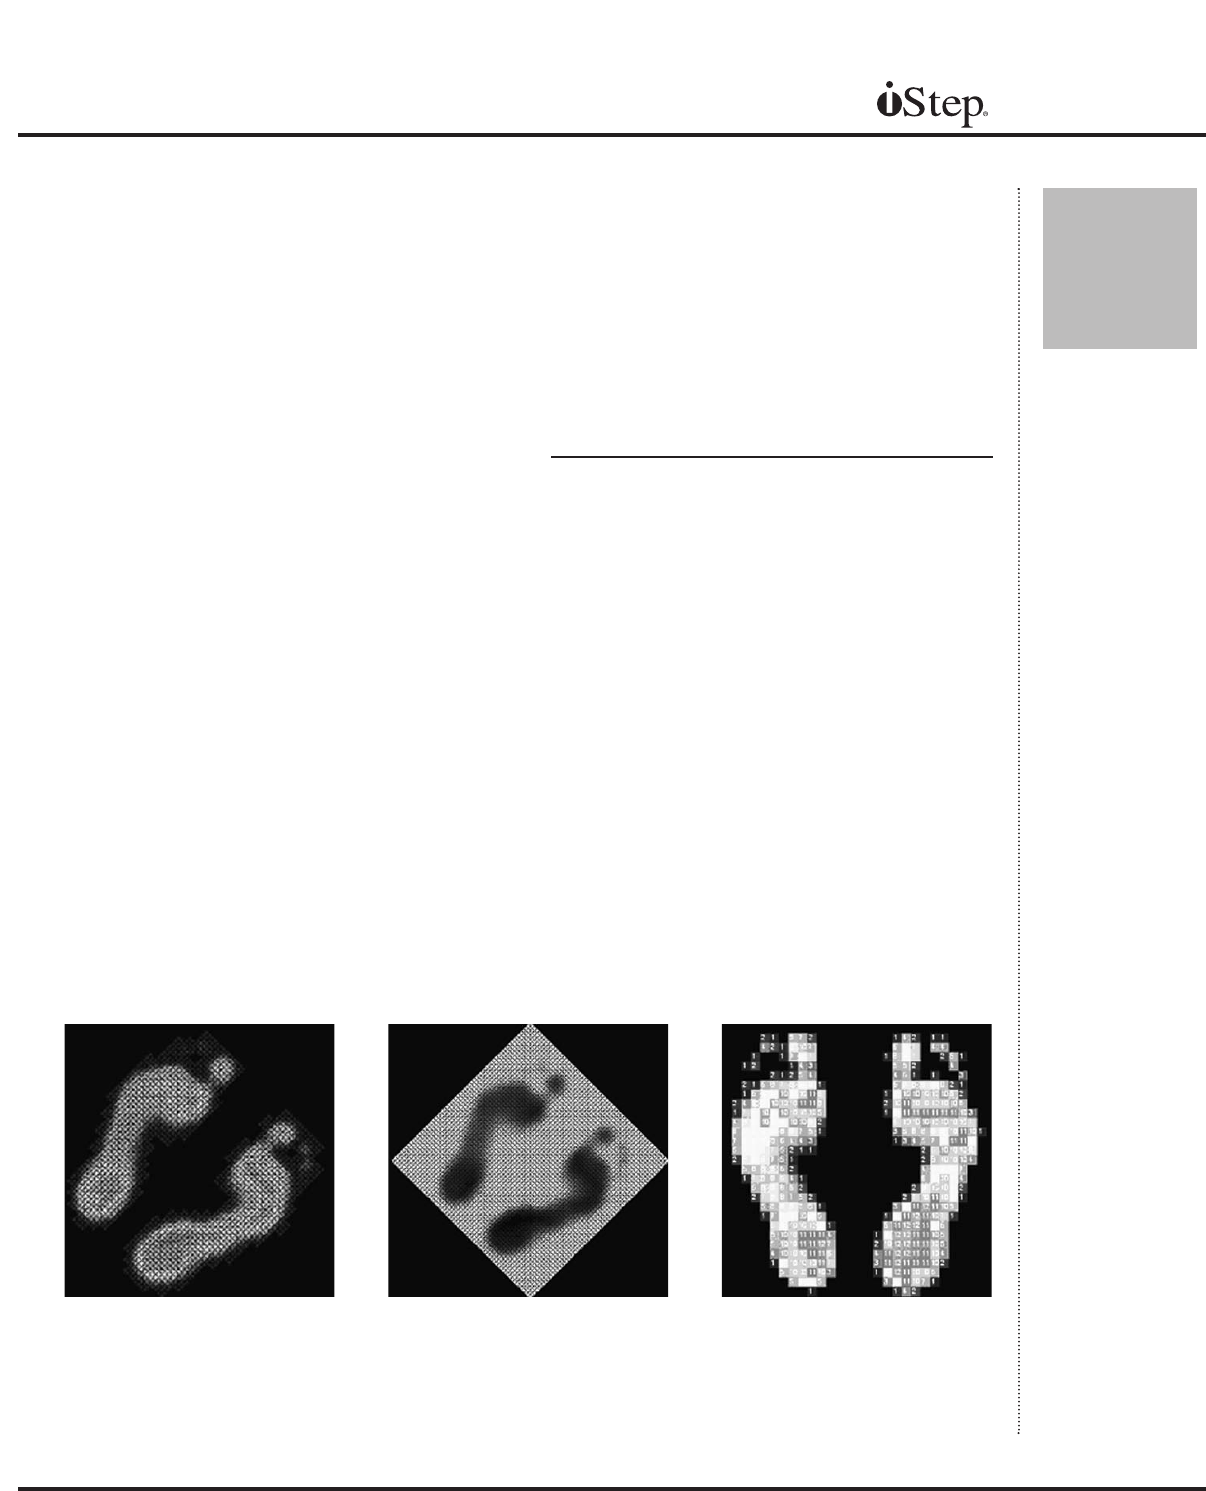
(Figure 4A) options begin with display
options. From the main test screen, click the
iStep logo to bring up the menu, and then click
‘Graphics’ and your display choice. Examples
shown below.
Graphics
2D Low Resolution 15 Colors (Figure 4A-1)
This is the default image displayed after a test.
2D Low Resolution 2 Colors (Figure 4A-2)
Th
edefault image displayed in black and white.
2D High Resolution 15 Colors (Figure 4A-3)
The image is shown with the same data, but
interpreted at greater resolution.
2D High Resolution 2 Colors (Figure 4A-4)
The high resolution in black and white most
resembles the classic Harris Mat image.
Numeric (Figure 4A-5)
This display shows the numeric values of the
colors displayed. Useful for diagnostic and
technical work.
15
Chapter
4
Menu Options - Part One
Manual
Fig. 4A-3 Fig. 4A-4 Fig. 4A-5
