SAP Online Help 07.09.2004
SAP NetWeaver Visual Composer: User Guide 207
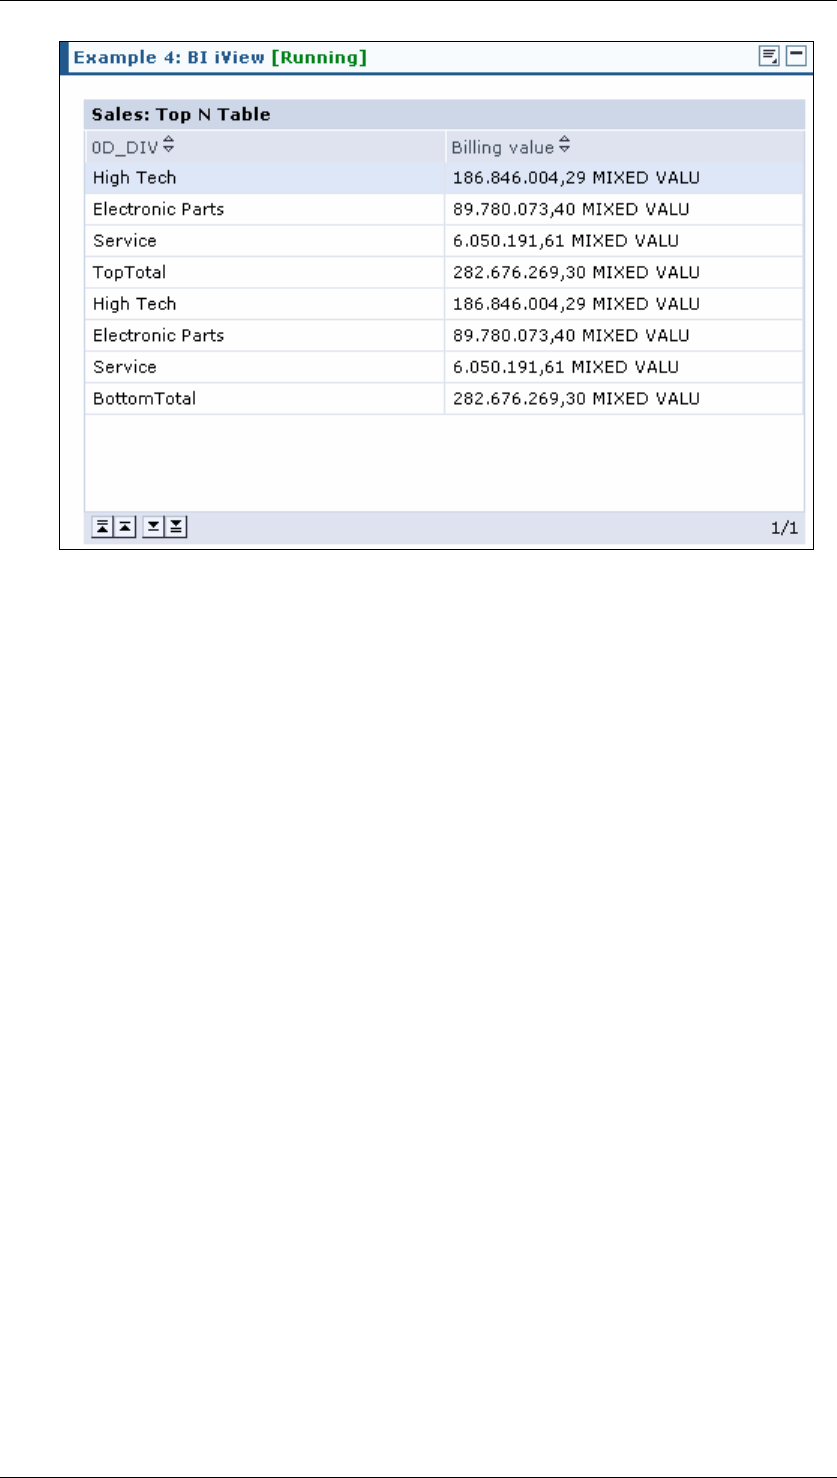
14. To display the results of a Top N query, decide you would prefer a column chart view
instead of a table view. Click the Design tab and delete the table view.
15. From the Elements panel, drag the Chart View to the workspace.
16. Click the output port of the Top N query and drag to connect to the input port of the
Chart View.
17. Select the Chart View, and go to the Designer panel.
18. On the Container tab, from the Chart Type section, select Columns.
19. Now you must map the fields to be displayed in the chart. Select the Fields panel, and
place a checkmark next to both Billing Value and F0D_DIV.
20. You want to swap the axes so that Division appears on the X axis. Change Billing
Value to Series 1 and F0D_DIV to X axis.
21. Adjust the iView layout by clicking the Layout tab and dragging the size of the chart to
be wider.
22. Preview the iView by clicking the Preview tab.
Result
As displayed on the Preview tab, the final iView might look something like this: