Chapter 2 97
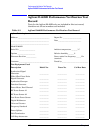
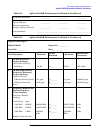
Performance Verification Tests
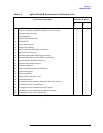
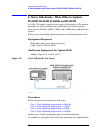
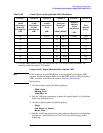
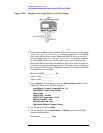
12. Display Scale Fidelity
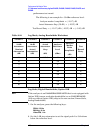
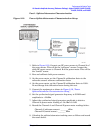
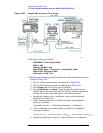
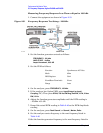
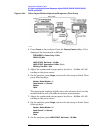
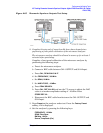
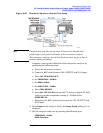
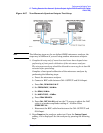
10.If the analyzer has a 75W Input press:
Input/Output (or Input)
Input Z Corr (75)
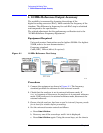
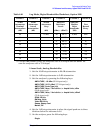
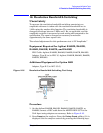
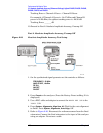
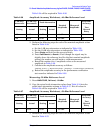
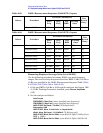
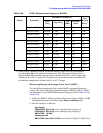
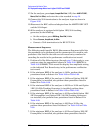
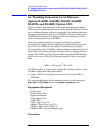
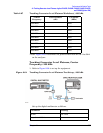
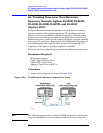
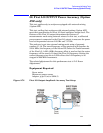
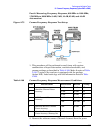
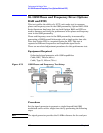
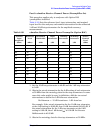
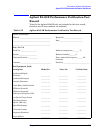
Zero Span Log Fidelity, Digital Bandwidths
This section is for analyzers with Option 1DR (narrow resolution
bandwidths) only.
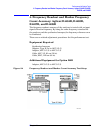
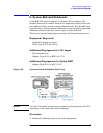
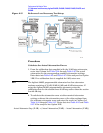
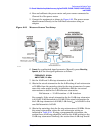
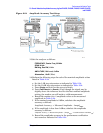
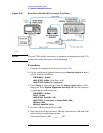
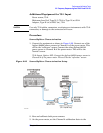
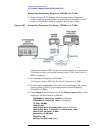
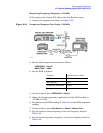
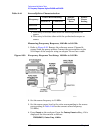
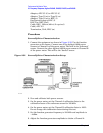
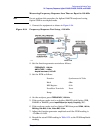
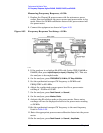
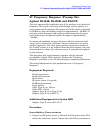
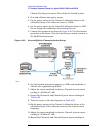
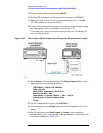
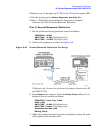
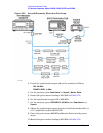
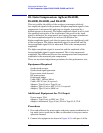
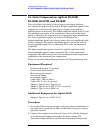
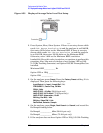
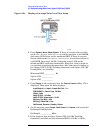
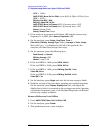
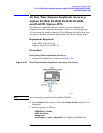
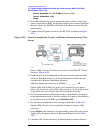
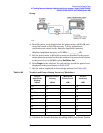
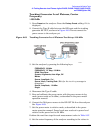
Setup for zero span measurements
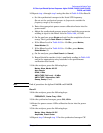
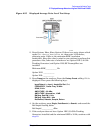
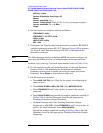
11.Set the 1 dB step attenuator to 11 dB and the 10 dB step attenuator to
110 dB.
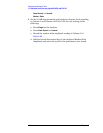
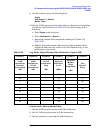
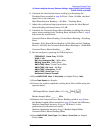
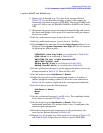
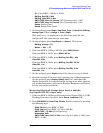
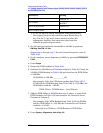
12.Press
Preset on the analyzer. Press the Factory Preset softkey, if it is
displayed. Set the analyzer by pressing the following keys:
System, Alignments
Align Now,
All (wait for the alignment sequence to complete)
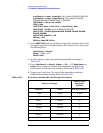
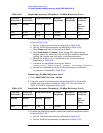
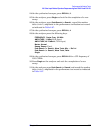
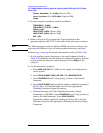
13.Set the 1 dB and 10 dB step attenuators to 0 dB.
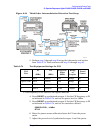
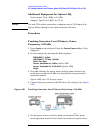
14.Set the following parameters on the analyzer:
FREQUENCY, 50 MHz
SPAN, 100 Hz
(ESA-E Series only)
SPAN, 500 Hz (ESA-L Series only)
BW/Avg, 10 Hz (ESA-E Series only)
BW/Avg, 100 Hz (ESA-L Series only)
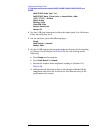
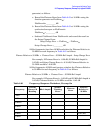
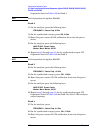
15.On the analyzer press
Peak Search (or Search), Marker –>, and Marker –> CF.
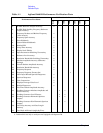
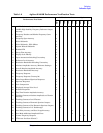
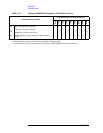
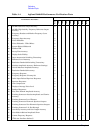
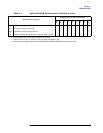
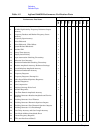
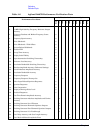
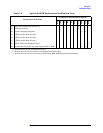
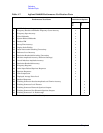
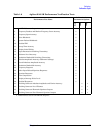
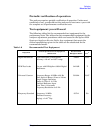
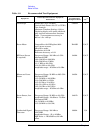
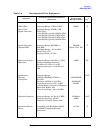
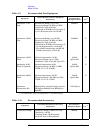
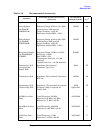
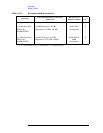
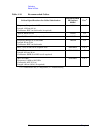
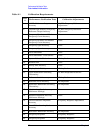
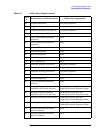
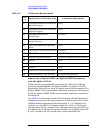
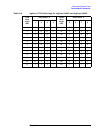
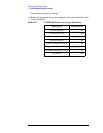
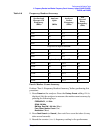
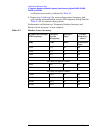
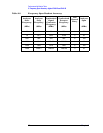
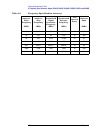
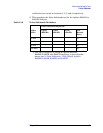
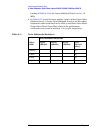
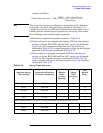
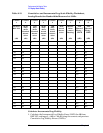
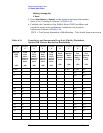
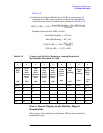
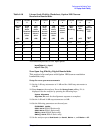
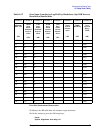
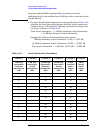
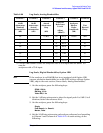
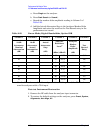
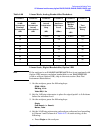
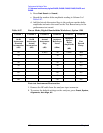
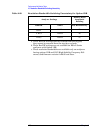
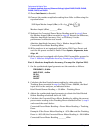
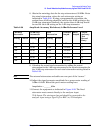
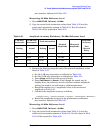
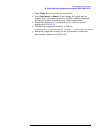
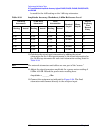
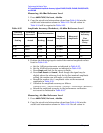
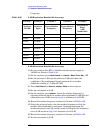
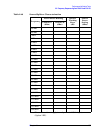
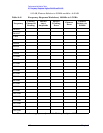
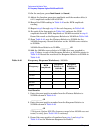
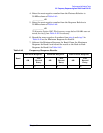
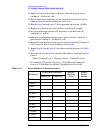
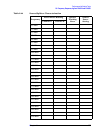
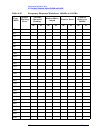
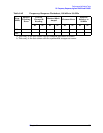
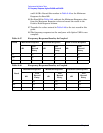
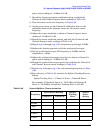
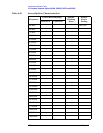
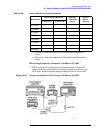
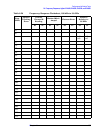
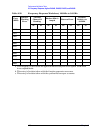
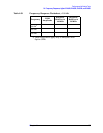
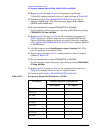
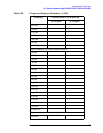
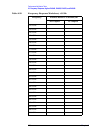
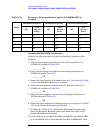
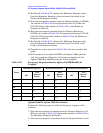
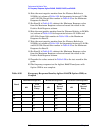
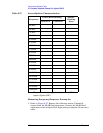
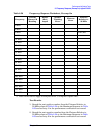
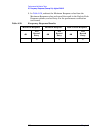
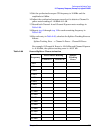
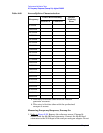
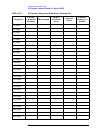
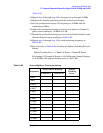
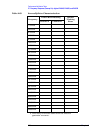
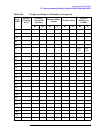
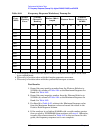
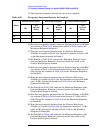
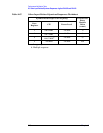
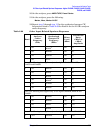
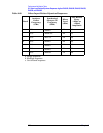
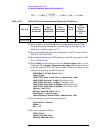
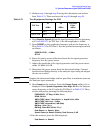
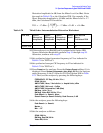
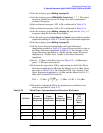
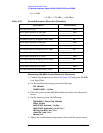
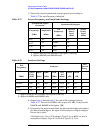
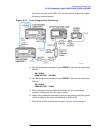
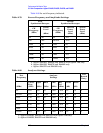
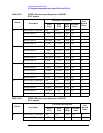
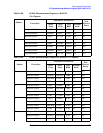
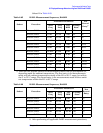
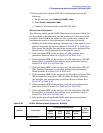
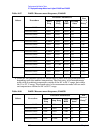
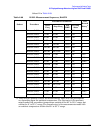
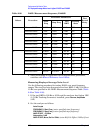
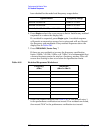
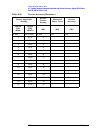
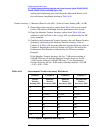
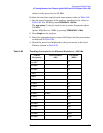
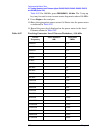
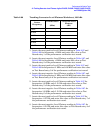
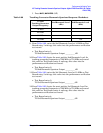
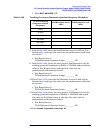
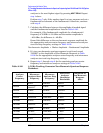
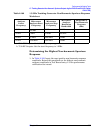
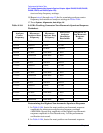
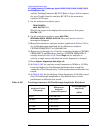
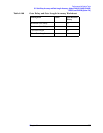
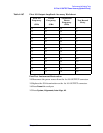
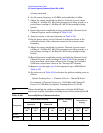
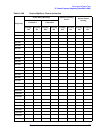
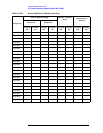
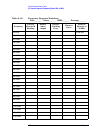
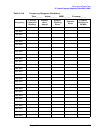
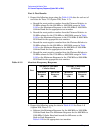
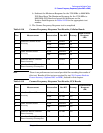
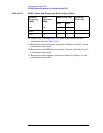
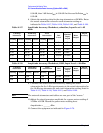
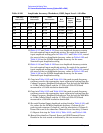
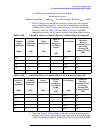
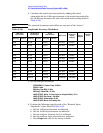
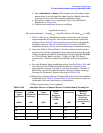
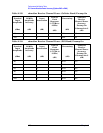
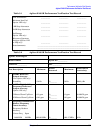
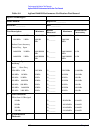
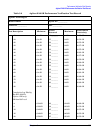
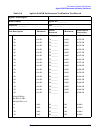
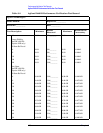
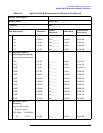
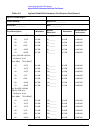
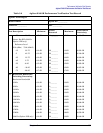
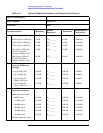
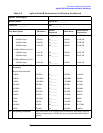
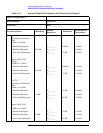
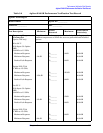
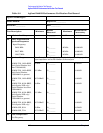
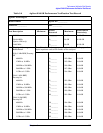
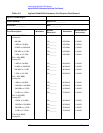
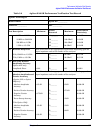
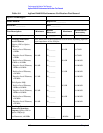
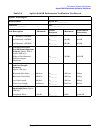
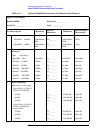
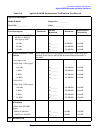
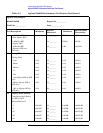
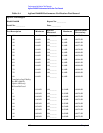
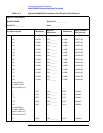
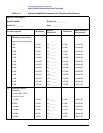
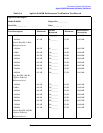
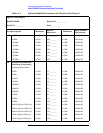
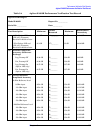
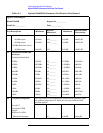
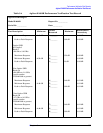
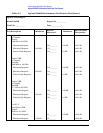
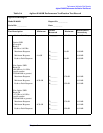
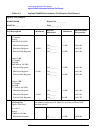
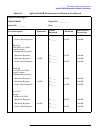
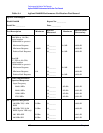
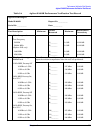
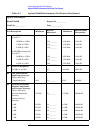
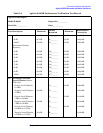
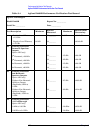
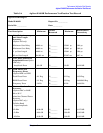
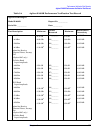
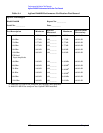
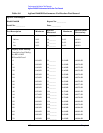
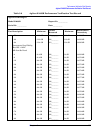
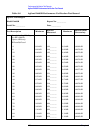
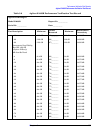
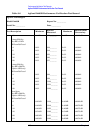
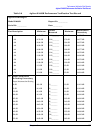
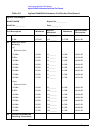
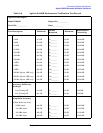
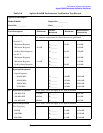
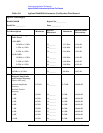
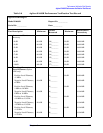
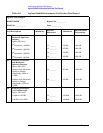
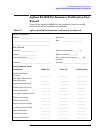
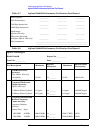
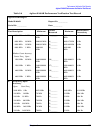
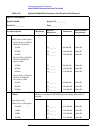
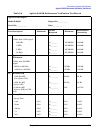
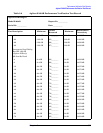
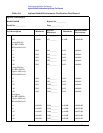
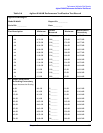
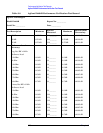
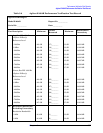
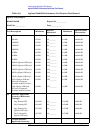
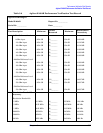
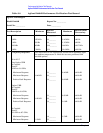
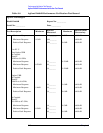
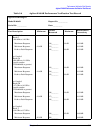
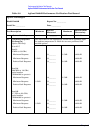
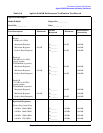
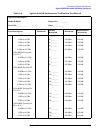
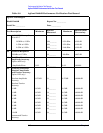
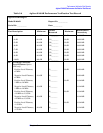
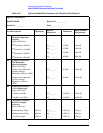
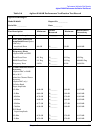
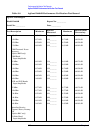
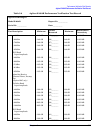
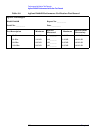
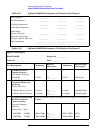
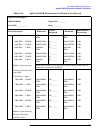
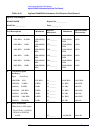
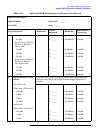
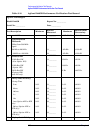
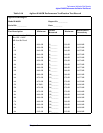
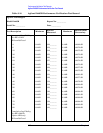
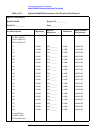
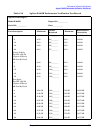
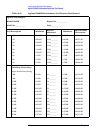
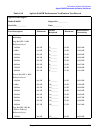
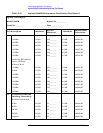
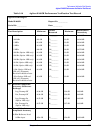
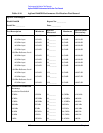
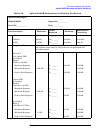
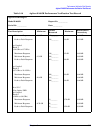
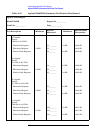
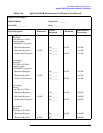
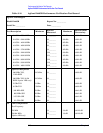
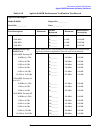
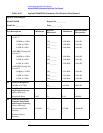
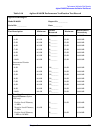
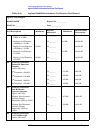
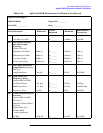
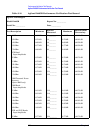
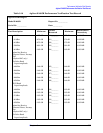
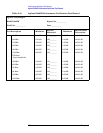
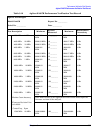
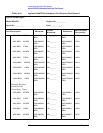
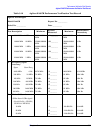
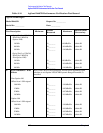
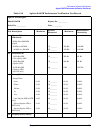
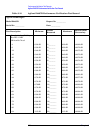
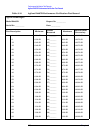
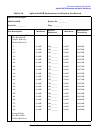
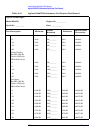
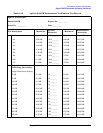
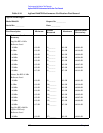
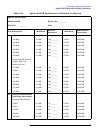
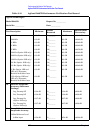
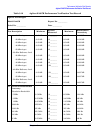
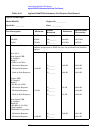
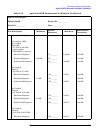
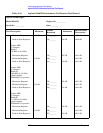
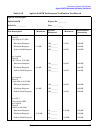
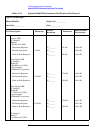
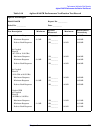
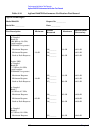
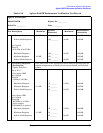
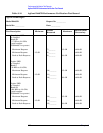
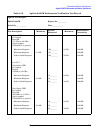
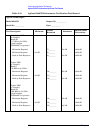
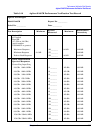
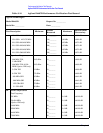
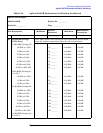
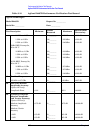
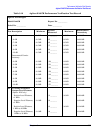
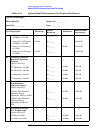
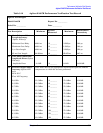
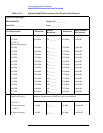
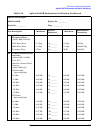
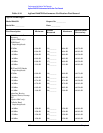
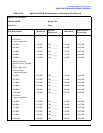
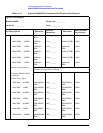
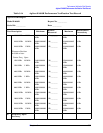
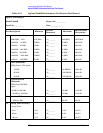
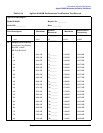
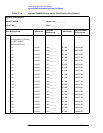
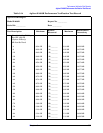
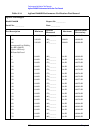
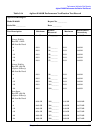
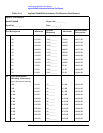
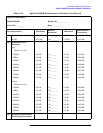
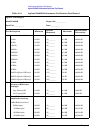
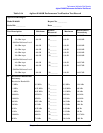
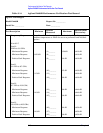
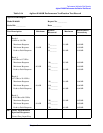
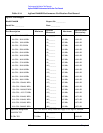
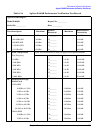
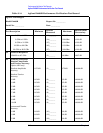
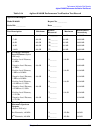
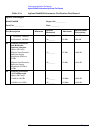
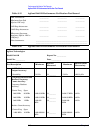
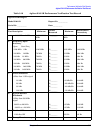
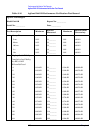
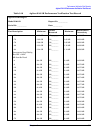
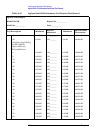
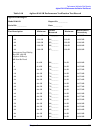
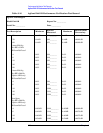
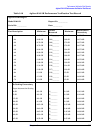
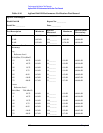
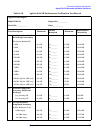
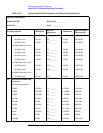
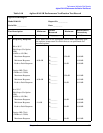
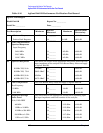
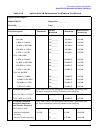
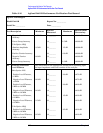
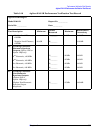
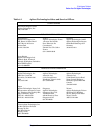
Table 2-16 Linear Scale Fidelity Worksheet, Option 1DR Narrow
Resolution Bandwidths
Column
1
Column
2
Column
3
Column
4
Column
5
Column
6
Column
7
Column
8
Column
9
dB from
REF
LVL
(dB)
10 dB
Step
Atten
Nominal
Attenu-
ation
(dB)
1 dB
Step
Atten
Nominal
Attenu-
ation
(dB)
10 dB
Step
Atten
Actual
Attenu-
ation
(dB)
1 dB
Step
Atten
Actual
Attenu-
ation
(dB)
Total
Actual
Attenu-
ation
(dB)
Ideal
Mkr
Reading
(mV)
Actual
Mkr
Reading
(mV)
Test
Record
Entry –
LFE
(% of
RL)
0 (Ref) 0 0 0 (Ref) 0 (Ref) 0 (Ref)
–4 0 4 98)
–8 0 8 99)
–12 10 2 100)
–16 10 6 101)
–20 20 0 102)