Chapter 2 241
Performance Verification Tests
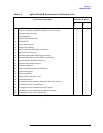
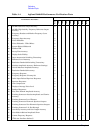
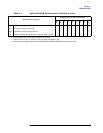
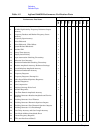
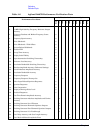
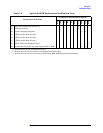
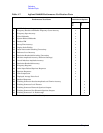
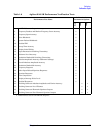
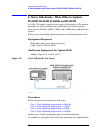
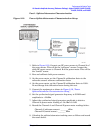
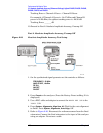
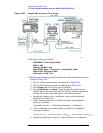
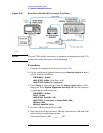
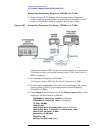
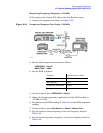
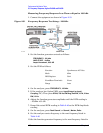
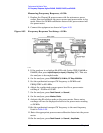
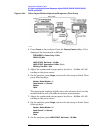
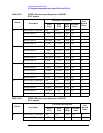
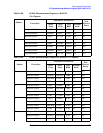
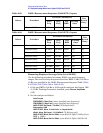
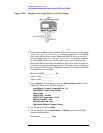
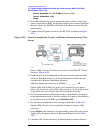
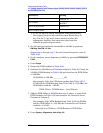
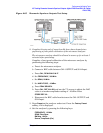
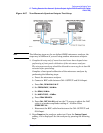
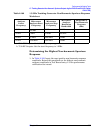
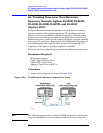
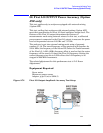
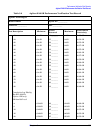
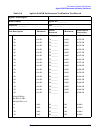
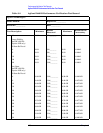
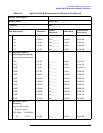
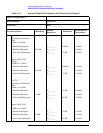
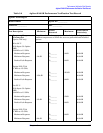
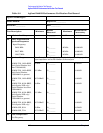
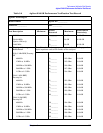
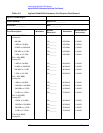
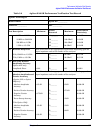
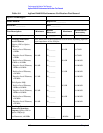
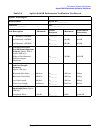
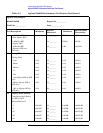
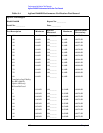
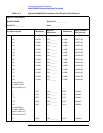
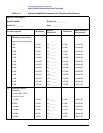
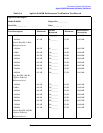
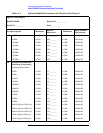
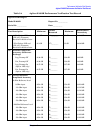
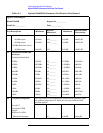
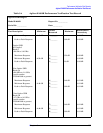
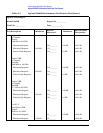
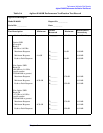
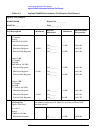
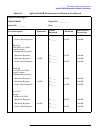
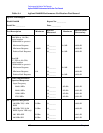
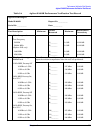
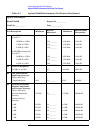
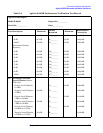
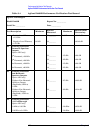
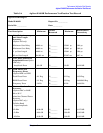
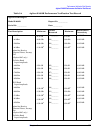
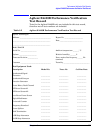
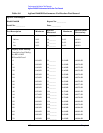
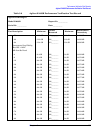
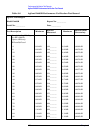
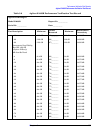
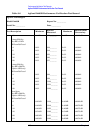
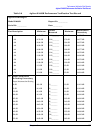
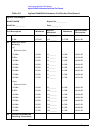
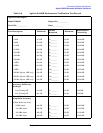
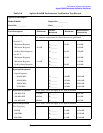
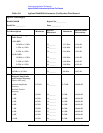
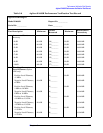
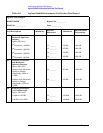
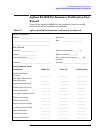
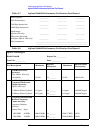
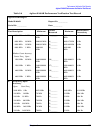
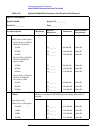
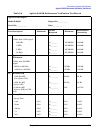
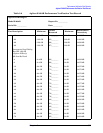
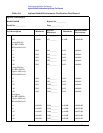
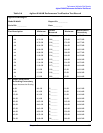
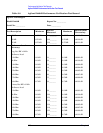
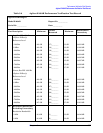
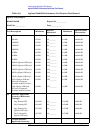
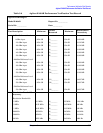
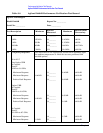
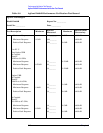
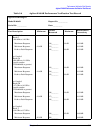
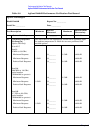
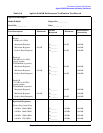
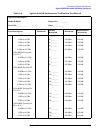
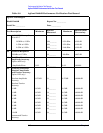
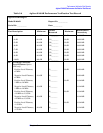
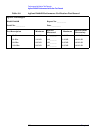
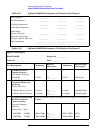
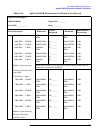
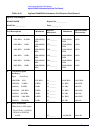
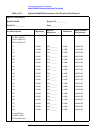
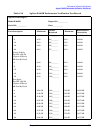
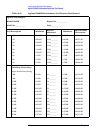
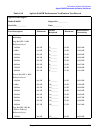
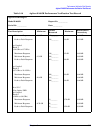
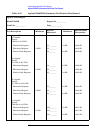
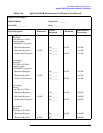
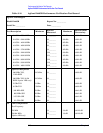
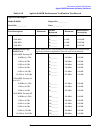
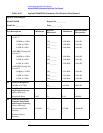
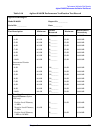
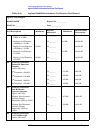
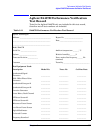
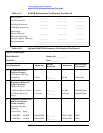
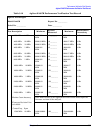
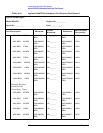
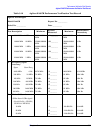
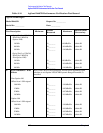
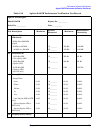
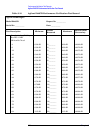
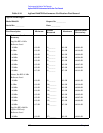
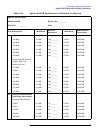
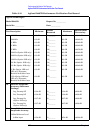
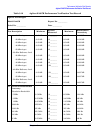
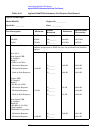
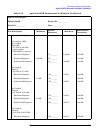
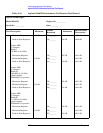
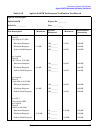
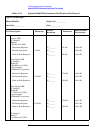
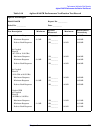
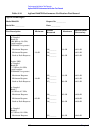
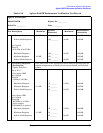
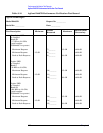
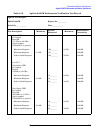
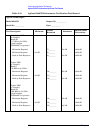
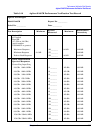
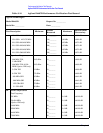
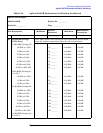
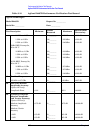
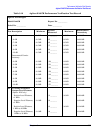
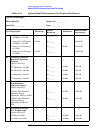
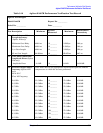
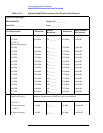
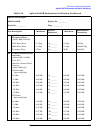
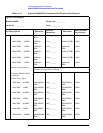
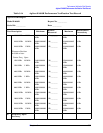
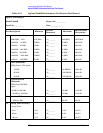
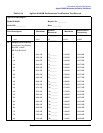
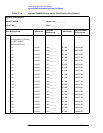
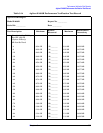
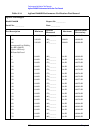
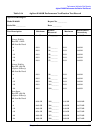
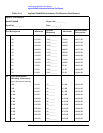
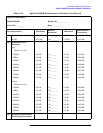
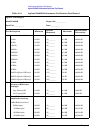
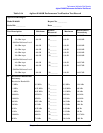
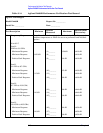
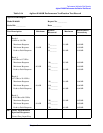
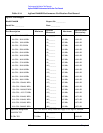
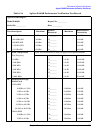
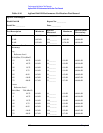
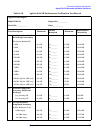
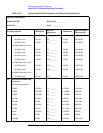
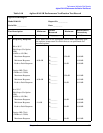
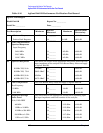
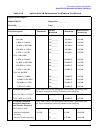
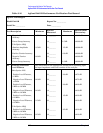
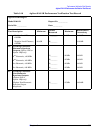
27. Frequency Response (Preamp On): Agilent E4404B, E4405B, and E4407B
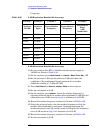
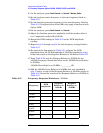
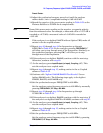
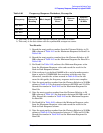
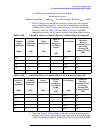
5. If the analyzer is an Agilent E4405B with a serial number greater
than or equal to US39440327 then continue with step 8. Otherwise,
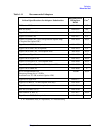
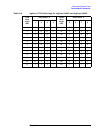
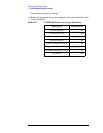
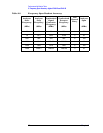
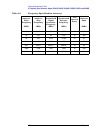
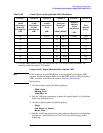
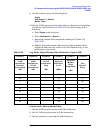
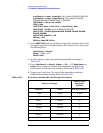
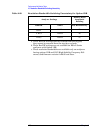
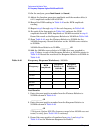
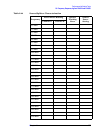
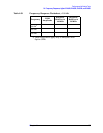
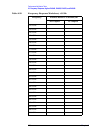
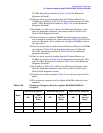
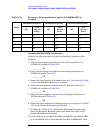
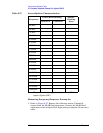
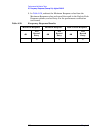
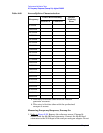
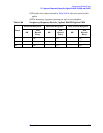
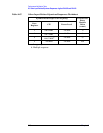
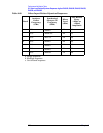
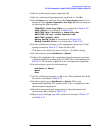
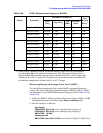
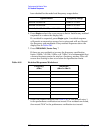
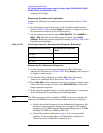
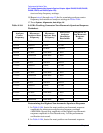
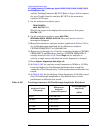
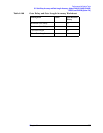
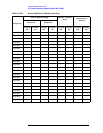
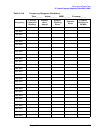
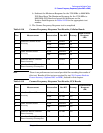
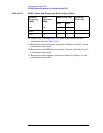
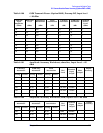
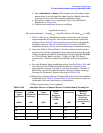
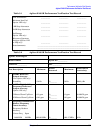
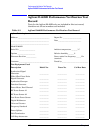
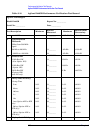
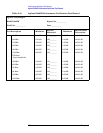
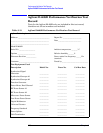
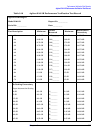
transfer the values entered in Table 2-65 to the test record in this
guide; the frequency response test is now complete.
6. If the analyzer is an Agilent E4407B with a serial number greater
than or equal to US39440871 and does not have Option UKB then
continue with step 8. Otherwise, transfer the values entered in Table
2-65 to the test record in this guide; the frequency response test is
now complete.
7. If the analyzer is an Agilent E4407B with Option UKB, continue
with step 16.
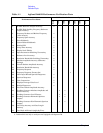
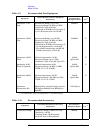
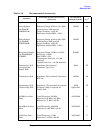
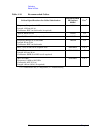
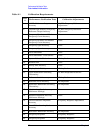
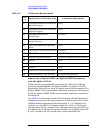
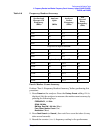
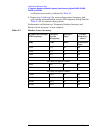
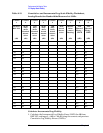
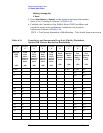
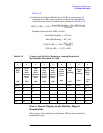
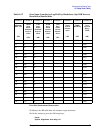
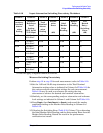
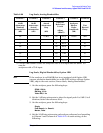
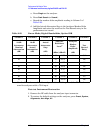
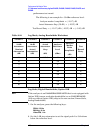
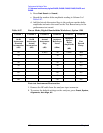
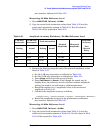
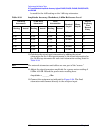
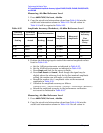
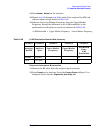
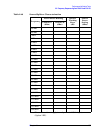
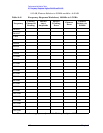
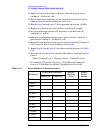
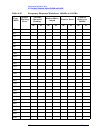
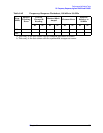
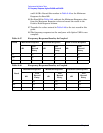
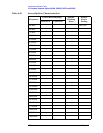
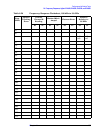
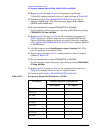
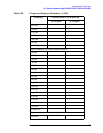
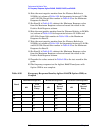
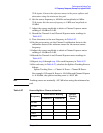
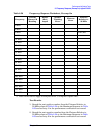
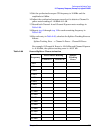
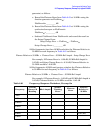
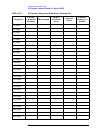
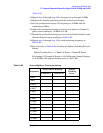
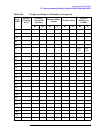
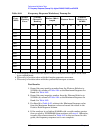
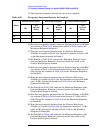
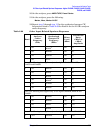
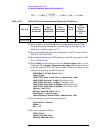
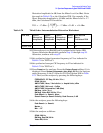
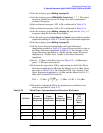
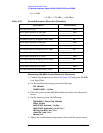
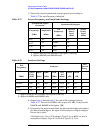
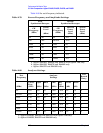
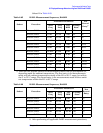
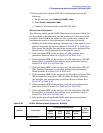
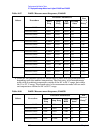
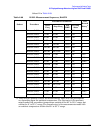
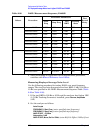
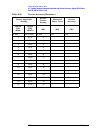
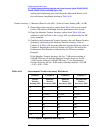
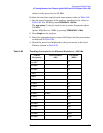
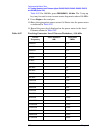
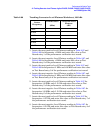
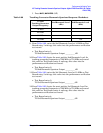
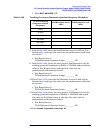
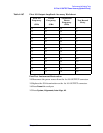
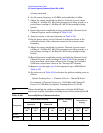
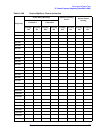
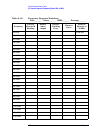
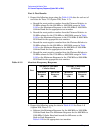
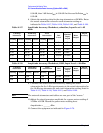
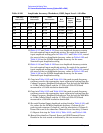
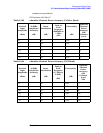
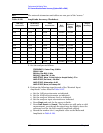
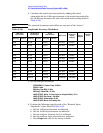
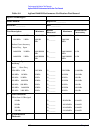
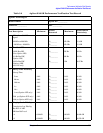
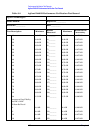
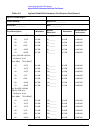
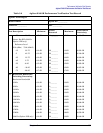
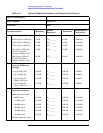
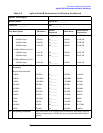
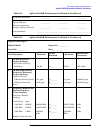
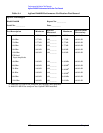
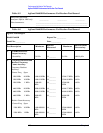
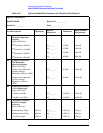
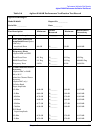
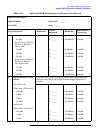
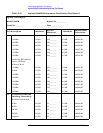
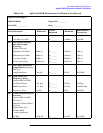
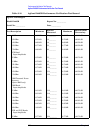
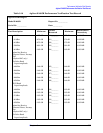
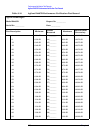
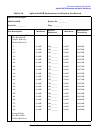
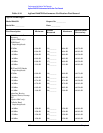
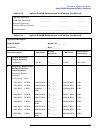
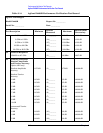
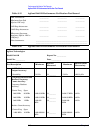
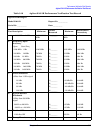
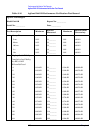
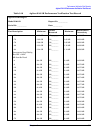
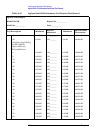
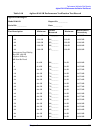
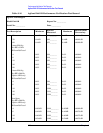
8. Note the most positive number from the Flatness Relative to 50 MHz
(dc) column of Table 2-64 for frequencies between 800 MHz and 1.0
GHz. Record the number in Table 2-65 as the Maximum Response
for Band 0A.
9. Note the most negative number from the Flatness Relative to
50 MHz (dc) column of Table 2-64 for frequencies between 800 MHz
and 1.0 GHz. Record the number in Table 2-65 as the Minimum
Response for Band 0A.
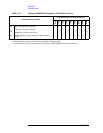
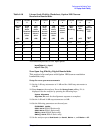
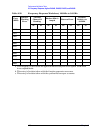
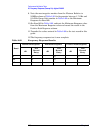
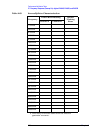
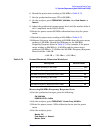
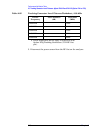
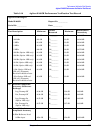
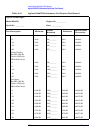
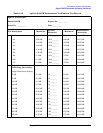
10.For Band 0A in Table 2-65, subtract the Minimum Response value
from the Maximum Response value and record the result in the
Peak-to-Peak Response column.
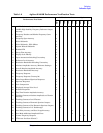
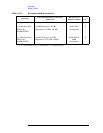
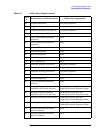
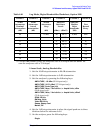
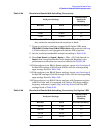
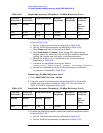
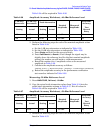
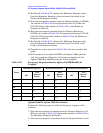
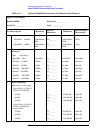
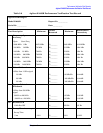
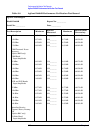
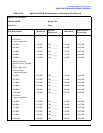
11.Note the most positive number from the Flatness Relative to 50 MHz
(dc) column of Table 2-64 for frequencies between 1.7 GHz and 2.0
GHz. Record the number in Table 2-65 as the Maximum Response
for Band 0B.
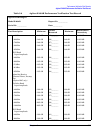
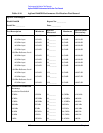
12.Note the most negative number from the Flatness Relative to
50 MHz (dc) column of Table 2-64 for frequencies between 1.7 GHz
and 2.0 GHz. Record the number in Table 2-65 as the Minimum
Response for Band 0B.
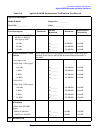
13.For Band 0B in Table 2-65, subtract the Minimum Response value
from the Maximum Response value and record the result in the
Peak-to-Peak Response column.
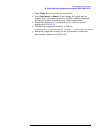
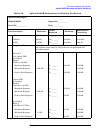
14.Transfer the values entered in Table 2-65 to the test record in this
guide.