Genelec Document D1031AR001 Copyright Genelec Oy 6.2003. All data subject to change without prior notice
AMPLIFIER SECTION
CROSSOVER SECTION
SYSTEM SPECIFICATIONS
Lower cut-off frequency, -3 dB:
Upper cut-off frequency, -3 dB:
Free field frequency response of system:
Maximum short term sine wave acoustic output on
axis in half space, av er aged from 100 Hz to 3 kHz:
Maximum long term RMS acoustic output in same
conditions with IEC weighted noise (limited by
driver unit pro tec tion cir cuit):
Maximum peak acoustic output per pair above
console top, @ 1 m from the engineer with music
Self generated noise level in free field @ 1m
Harmonic distortion at 90 dB SPL @ 1m on axis:
Treble 19 mm (3/4") metal dome
Both drivers are magnetically shielded.
Bass amplifier short term output power with a
Treble amplifier short term output power with an
Long term output power is limited by driver unit
Amplifier system distortion at nominal out put:
Signal to Noise ratio, referred to full out put:
Input connector XLR female:
Input level for 100 dB SPL output @ 1m:
variable from +6 to -6 dBu
Input level for maximum short term sine wave output
variable from +16 to +4 dBu
Subsonic filter below 45 Hz :
Ultrasonic filter above 25 kHz:
Crossover frequency, Bass/Treble:
Crossover acoustical slopes:
Treble tilt control operating range in 2 dB steps:
Bass roll-off control operating range in 2 dB steps:
Bass tilt control operating range in 2 dB steps:
The 'CAL' position is with all tone con trols set to 'off'
and the input sensitivity con trol to maximum (fully
FIN-74100, Iisalmi, Finland
Email genelec@genelec.com
In the U.S. please contact:
Genelec, Inc., 7 Tech Circle
Email genelec.usa@genelec.com
Genelec China Representative Office
Soho New Town, 88 Jianguo Road
D-1504, Chaoyang District
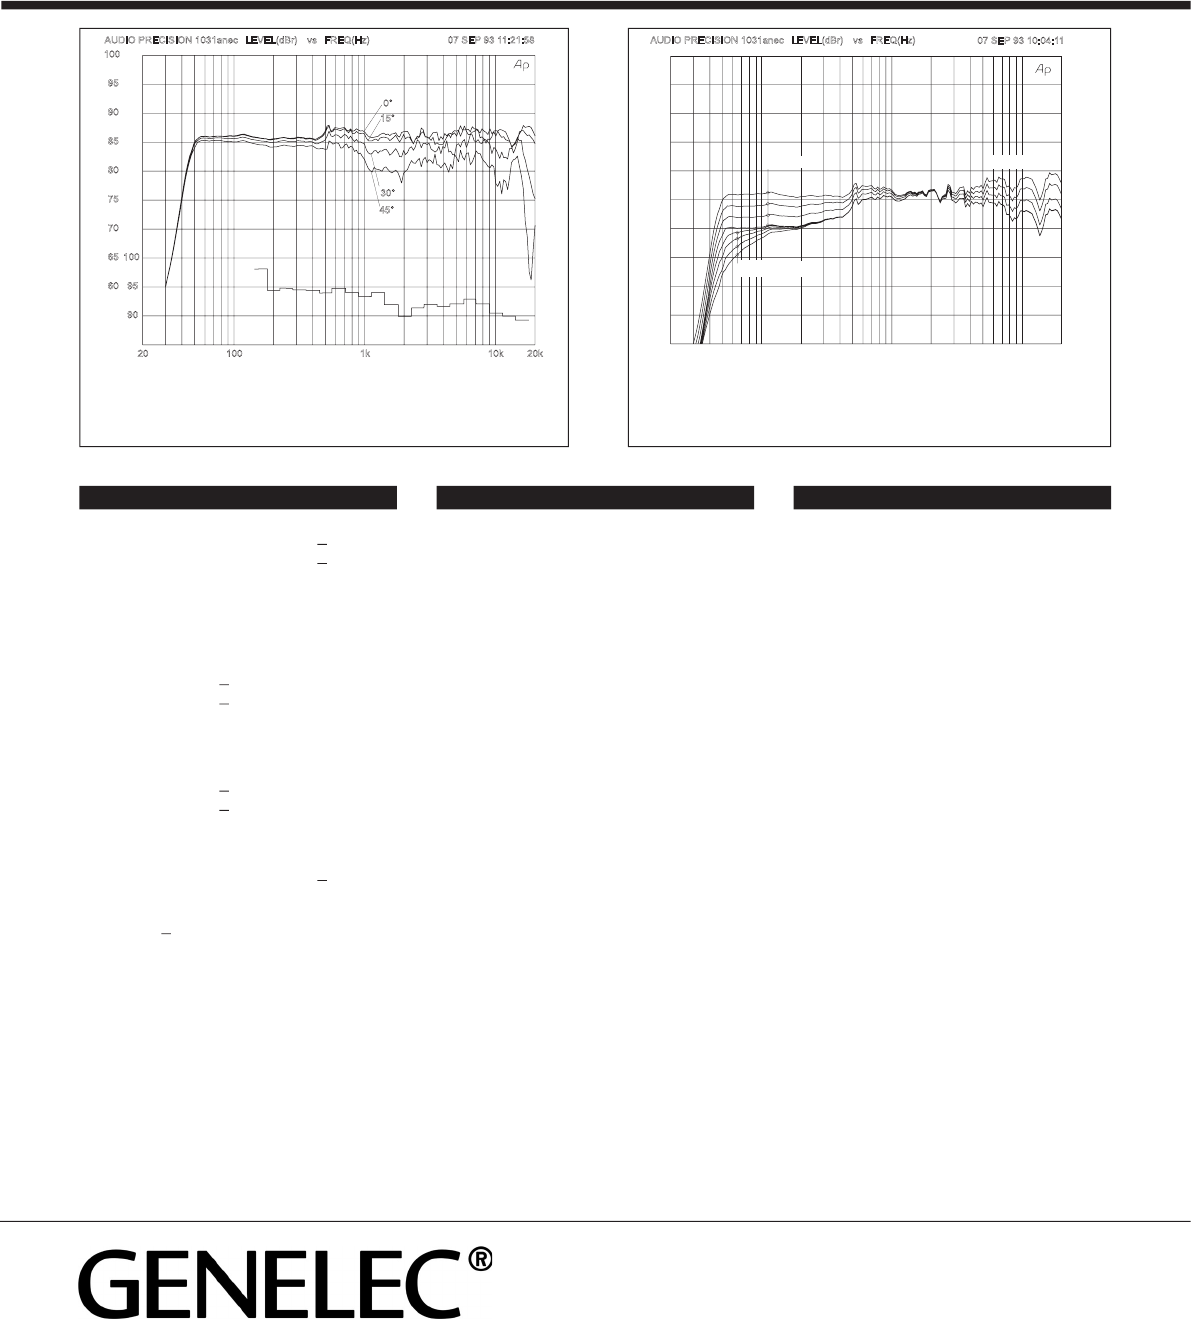
Figure 4. The upper curve group shows the horizontal directivity
characteristics of the 1031A in vertical configuration measured at 1 m.
The lower curve is a 1/3 octave band power response, measured in an
IEC approved reverberation chamber.
Figure 5. The curves show the effect of the bass tilt, treble tilt and
bass roll-off controls on the free field response.
BASS TILT
TREBLE TILT
BASS ROLL-OFF
60
65
70
75
80
85
90
95
100
20
100
1k
10k
20k
105
110
AUDIOPRECISION1031anec
vs
07SEP9310:04:11
LEVEL(dBr)
FREQ(Hz)
90
95
100
15°
30°
AUDIOPRECISION1031anec
vs
07SEP9311:21:58
60
65
70
75
80
85
90
95
100
LEVEL(dBr)
20
100
1k
10k
20k
FREQ(Hz)
45°
0°